Archives for May 2012

3.8% Tax Starting in 2013: What Does It Mean?

3.8

The health care legislation enacted in 2013 included a new tax that was designed to affect upper income taxpayers. Understand this tax will not be imposed exclusively on real estate transactions. The tax is NOT a transfer tax on real estate sales and similar transactions.

Rather, when the legislation becomes effective it may entail a 3.8% tax on some (but not all) income from interest, dividends, rents (less expenses) and capital gains (less capital losses). These items are all included in an individual’s adjusted gross income (AGI). The tax will fall only on individuals with an AGI above $200,000 and couples filing a joint return with more than $250,000 AGI

The new tax does NOT eliminate the benefits of the $250,000/$500,000 exclusion on the sale of a principal residence. Thus, ONLY that portion of a gain above those thresholds is included in AGI and could be subject to the tax.

Tax payers should familiarize themselves with the tax. The amount of tax will vary from individual to individual because the elements that comprise AGI differ from taxpayer to taxpayer. Contact me today for a referral to a licensed tax professional.

Home Prices to Rise 4% Per Year?

home pricesHave home prices finally hit bottom? Many analysts think so. According to the latest forecast by Fiserv, the market watcher sees a big boost to home prices on the horizon, projecting that home prices will rise nearly 4 percent per year for the next five years.

The real estate markets expected to see the biggest increases in home prices will likely be those hardest hit the last few years by foreclosures, such as in Phoenix and Las Vegas, and areas where prices have fallen the most, according to Fiserv’s forecast.

Housings rising affordability mixed with falling inventories of for-sale homes are the main factors driving the expected price increases, according to Fiserv.

Initially, investors are expected to help drive most of this price increase, and then followed by first-time and trade-up buyers as they re-emerge in bigger numbers to the market.

If this prediction is correct. A home on the Eastside (Bellevue, Redmond, Kirkland et al) would go from $512,000.00 to $532,480.00, then to $553,779.00 by the year 2014. Not inconsequential numbers to be sure.

Source: “U.S. Home Prices Could Rise 4% a Year, Forecast Says,” USA Today (May 8. 2012)

Housing finds a balance between supply and demand

Although regionally, home prices vary, as a nation, there is little change between this year and last year, with CoreLogic implying price stabilization is the current state of the market.

Healthy_Home_design

Home prices stabilizing

With a 0.6 percent drop in home prices between March 2011 and March 2012 and a 0.6 percent increase in prices from February, CoreLogic’s Home Price Index (HPI) shows that national home prices not only saw the first month-over-month increase since July 2011, the movement up and down is slight, indicating the market has found its bottom. Excluding distressed sales, month-over-month prices increased for the third month in a row. The CoreLogic HPI also shows that year-over-year prices, excluding distressed sales, rose by 0.9 percent in March 2012 compared to March 2011.

“This spring the housing market is responding to an improving balance between real estate supply and demand which is causing stabilization in house prices,” said Dr. Mark Fleming, chief economist for CoreLogic. “Although this has been the case in each of the last two years, the difference this year is that stabilization is occurring without the support of tax credits and in spite of a declining share of REO sales.”

“While housing prices remain flat nationally, in many markets tighter inventories are beginning to lift home prices,” said Anand Nallathambi, president and chief executive officer of CoreLogic. “This is true in Phoenix, New York and Washington, for example, which all reflect higher home price values than a year ago. A continuation of this trend will be good for our industry across U.S. markets.”

Regional performances vary

As always, all real estate is local and some states continue to perform extremely well while others continue to decline. Including distressed sales, the states with the highest appreciation were Wyoming (+5.9 percent), West Virginia (+5.3 percent), Arizona (+5.1 percent), North Dakota (+4.7 percent) and Florida (+4.5 percent) and excluding distressed sales, the top performers for March were Idaho (+5.4 percent), North Dakota (+5.1 percent), South Carolina (+4.7 percent), Montana (+3.5 percent) and Kansas (+3.4 percent).

Not everyone had such stellar results, however, as CoreLogic reports that including distressed sales, the states with the greatest depreciation were Delaware (-10.6 percent), Illinois (-8.3 percent), Alabama (-8.0 percent), Georgia (-7.3 percent) and Nevada (-5.8 percent), and excluding distressed sales, the poorest performers were Delaware (-7.6 percent), Alabama (-4.1 percent), Nevada (-3.9 percent), Vermont (-3.9 percent) and Rhode Island (-2.9 percent).

Including distressed transactions, the peak-to-current change in the national HPI (from April 2006 to March 2012) was -33.7 percent. Excluding distressed transactions, the peak-to-current change in the HPI for the same period was -24.5 percent. The five states with the largest peak-to-current declines including distressed transactions are Nevada (-59.9 percent), Arizona (-48.6 percent), Florida (-48.1 percent), Michigan (-45.1 percent) and California (-42.7 percent). Of the top 100 Core Based Statistical Areas (CBSAs) measured by population, 57 are showing year-over-year declines in March, eight fewer than in February.

1 Housing finds a balance between supply and demand
2 Housing finds a balance between supply and demand
3 Housing finds a balance between supply and demand
4 Housing finds a balance between supply and demand

(via)

The Internet of Yesterday vs. Today [infographic]

1996-vs-2011

Short Sales Will Increase Dramatically in 2012

Short-Salesby THE KCM CREW

We believe that short sales will be a major part of the real estate market in 2012. That is why we have dedicated this entire week to posts exclusively on this subject. We hope that by the end of the week you have a better handle on the need for short sales and a better understanding of the process. – the KCM Crew

It seems that the banks have finally realized that a short sale is a better option than foreclosure for them, the homeowner and the neighborhood. It is for this reason we believe that 2012 will come to be known as the year of the short sale.CNN Money reported on this exact point:

“We believe 2012 could be a record year for short sales,” said Daren Blomquist, vice president at RealtyTrac.

Banks are showing signs of being more open and willing to approve the deals — even if it means accepting less money. The average sales price for a short sale was $174,120 in January, down 4% from December and 10% year-over-year.

Market Watch also addressed the short sale situation recently:

Fitch expects the increase in short sales to continue because of the potential benefits afforded to both lenders and borrowers. Some borrowers may prefer short sales because, though they cannot stay in the property, they often walk away with cash incentives from lenders and healthier credit reports unmarred by foreclosure. For lenders, short sales provide a more efficient and cheaper alternative to the increasingly lengthy and costly foreclosure process.

Why Are the Banks Now Leaning Towards Short Sales?

The simple answer is that the banks lose less money when doing a short sale. The CNN Money article mentioned above explains:

Typically, banks get about 20% less for a foreclosed home. Foreclosure can also take years to unload, during which expenses, like property taxes, insurance and other expenses, mount up.

The Market Watch report breaks it down further:

Short sales…are currently getting completed 20 months after the last payment made on the loan, approximately 10 months less than the average time to foreclose. Shorter timelines reduce lenders’ carrying costs (i.e. accrued loan interest and property taxes, insurance, and maintenance) and eliminate most of the legal expenses associated with foreclosure and liquidation. As a result, loss severities tend to be considerably lower. Historically, for loans with similar attributes, short sales have severities 10%-15% less than REO sales. As the proportion of short sales increases, we expect average loss severities to improve further.

How Many Short Sales Could Be Completed?

JPMorgan has projected that over 500,000 short sales will be done this year. Also,NECN.com recently reported:

RealtyTrac estimates that if the January numbers it found hold up, there would be about 105,000 “pre-foreclosure” sales of homes, most of them short sales, during the first quarter of this year, and at that rate something like 400,000 for the year.

How Long Will Short Sales Be a Major Part of the Market?

The NECN article shows us that short sales are here to stay for some time.

According to the Mortgage Bankers Association, there are nearly 3.5 million homeowners delinquent on their mortgages by at least one month, including 1.5 million who are 90 days or more behind on paying their mortgage. And there are 12.5 million homeowners still who are “underwater,” owing more on their mortgage than their home is worth. That suggests that at the current rates, barring some spectacular economic recovery, it would take years, even decades, for short sales alone to clean up the mortgage mess that remains.

Short sales are here to stay. We must accept this fact and work hard to learn the process and apply it where it makes sense.

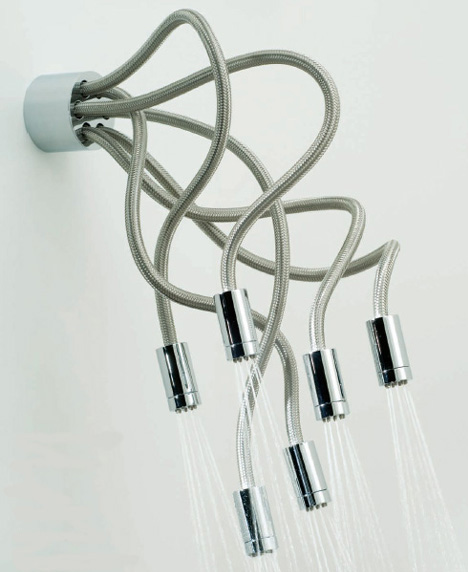
Snake & Spray: Twisted Medusa-Style Shower Head Design

Instead of struggling to get that perfect angle, this alternative shower fixture lets you manipulate six different sprayers to achieve a perfectly relaxing clean.

Designed by Vado, each of the articulated metal armatures ends in a multi-spray spigot so no matter what way you twist or turn things you still get good coverage from the individual elements.

The result can be attached to wall or ceiling, and, of course, you could always add more than one for some serious shower-time fun.

What Foreclosure Wave? False Alarm?

repossessed houses for saleSince I am involved in the John L. Scott Foreclosure Team, I see what happens every Friday at auction. The amount of homes sold at auction is pitifully small. Those I work with don’t see a flood coming. The banks are starting to realize the folly of some of their choices.

Many housing experts for months have been warning a foreclosure wave would soon flood several markets throughout the country. But was it all a false alarm?

Recent surveys have shown that foreclosure sales have dropped to their lowest point in more than two years. And while according to March data, 8 percent more homes did enter the foreclosure process from the previous month, that number is down more than 30 percent from a year ago, according to Lender Processing Services.

CNBC real estate reporter Diana Olick notes that it could be another delay in the foreclosure system “as banks try to modify more loans to meet some of the terms of the [$25 billion] servicing settlement. The foreclosure sales decline also appears to be exclusively in private and portfolio loans, which again points to the settlement.”

Meanwhile, banks are increasing their number of short-sale transactions, and some surveys have shown that short sales are actually now outpacing foreclosure sales — the first time that’s ever occurred.

“Lenders are increasingly recognizing that short sales may be a better alternative for them than foreclosure,” RealtyTrac’s Daren Blomquist told CNBC. “This trend began in markets with stronger demand and where the distressed inventory tends to be newer homes (Phoenix, Los Angeles, Las Vegas), but the trend appears to be spreading to other markets like Atlanta and Detroit.”

Source: “Flood of Foreclosures Still Fails to Materialize,” CNBC (May 2, 2012)

A Home Buying Gets Another Boost in Affordability

Housing_affordabilityFor home buyers or refinancers, borrowing costs for home ownership just got a little cheaper as mortgage rates took another dip to new all-time record lows this week, Freddie Mac reports in its weekly mortgage market survey.

"Signs of slowing economic growth and inflation remaining subdued allowed yields on Treasury bonds to ease somewhat and brought most mortgage rates to new all-time record lows this week,” says Frank Nothaft, Freddie Mac’s chief economist.

Here’s a closer look at average rates for the week ending May 3:

  • 30-year fixed-rate mortgages: averaged 3.84 percent, with an average 0.8 point, reaching a new historical low. The previous record for 30-year rates was 3.87 percent, which was set on Feb. 9 of this year. A year ago at this time, rates averaged 4.71 percent. 

  • 15-year fixed-rate mortgages: averaged 3.07 percent, with an average 0.7 point, another historical low. The previous record for 15-year rates was 3.11 percent set on April 12 this year. A year ago at this time, 15-year rates had averaged 3.89 percent. 

  • 5-year adjustable-rate mortgages: averaged 2.85 percent, with an average 0.7 point, holding the same as last week. Last year at this time, 5-year ARMs averaged 3.47 percent. 

  • 1-year ARMs: averaged 2.70 percent this week, with an average 0.6 point, also registering at a new all-time low. Last year at this time, 1-year ARMs averaged 3.14 percent.

Source: Freddie Mac

Square Foot Gardening: How to Get Started for $50 (Infographic)

120430Gardening2

(via)