Archives for April 2012

Further Proof the Real Estate Market Is Coming Back

Last week, the National Association of Realtors (NAR) released their Pending Sales Report which showed that contracted sales were 12.8% higher than the same month last year and higher than any time since sales were impacted by the Homebuyers’ Credit back in April of 2010. The index stood at 101.4 which represents a level that is “historically healthy” (see methodology below).

Here is a graph showing pending sales over the last twelve months:

METHODOLOGY (as per NAR)

The Pending Home Sales Index is a leading indicator for the housing sector, based on pending sales of existing homes. A sale is listed as pending when the contract has been signed but the transaction has not closed, though the sale usually is finalized within one or two months of signing.

The index is based on a large national sample, typically representing about 20 percent of transactions for existing-home sales. In developing the model for the index, it was demonstrated that the level of monthly sales-contract activity parallels the level of closed existing-home sales in the following two months.

An index of 100 is equal to the average level of contract activity during 2001, which was the first year to be examined as well as the first of five consecutive record years for existing-home sales; it coincides with a level that is historically healthy.

(via)

Short Sales Map: Percentage Of Sales

Short-Sale-Percentages

(via)

Proof That Real Estate Is ALWAYS Local: The Truth On Pricing

Case-Schiller released their data today with the bold headline that homes are at 2002 prices. While it may be true for a National average, I wasn’t convinced that our region reflected that statement, so I went looking for the truth.

Below is the chart that Case-Schiller released. It shows that prices have declined back to their 2002 prices.

chart-of-the-day-case-shiller

A closer look regionally would not fully support Case-Schiller’s claims. The MLS data for King County allows us to go back to the end of 2003. Average Sold prices are very close to 2003.

TGChartImage

This (Below) may be the best evidence that we in King County, Seattle and Bellevue are NOT in alignment with the Case-Schiller report. Back in 2002: King average was at $266K / Seattle at $296K / Bellevue at $372K

Zillow 1 

Below shows that in 2012: King is at $329K / Seattle is $387K / Bellevue is $512K

Zillow 2

Taking this same data (below), one could argue that we are more likely back to 2005 prices.

Zillow 3

What do you think? Let me know.

Music festivals: Then vs. now [infographic]

music festivalConcerts have changed a lot since the Woodstock days of the late 1960s. Here’s an infographic that compares how technology is used by fans at music festivals such as the Coachella Valley Music and Arts Festival in California compared to the iconic Woodstock festival held in 1969.

Now, concerts incorporate lots of advanced technology. Not only do some shows include holographic images of deceased artists and boast interactivity such as texting song requests to bands in real time, but it’s far easier to connect with family and friends back home than ever.

“In 1969, fashion defined a generation,” the infographic notes. “People expressed themselves by what they wore. Today, the most expressive accessory is our smartphone.”

Although 66% of concert goers nowadays take pictures at concerts via their smartphones, music fans carried around Polaroid cameras in the ’60s. These wonky devices weighed about 2.5 pounds and could take eight pictures with each pack. Smartphones weigh a lean 4.3 ounces and can hold about 5,722 photos.

SEE ALSO: 5 Most Popular Musicians to Subscribe to on Facebook

Meanwhile, people once lined up at pay phones to make calls to friends and families during concerts. Now, about 32% send Facebook updates or tweets from a show and 47% of ticket holders text and email others while at a show.

In addition, long gone are the days where lighters were used to signal a ballad or encore — the glow from smartphones accomplish the same thing.

Please note: You may need to expand your browser width to see this extra-wide graphic.

music-infographic

Single Family Rentals Now Exceed Multifamily

rent-for-housesWhile inventories of homes for sale have been shrinking this spring, MLSs are filling the void with rental listings for single family homes that until recently were foreclosures. Some 16.1 percent of all listings on MLSs today are rentals, more than double the number in 2006, according to some reports.

Single family rentals are $3 trillion business today and growing as investors turn to real estate and opt to rent out the bargains they buy until prices improve. Today the single family rental market accounts for 21 million rental units or 52 percent of the entire residential rental market, according to a new study by CoreLogic economist Sam Khater.

Yet the single family rental market is poorly understood and almost invisible to economists and journalists because virtually all rental market data tracks multifamily properties and either ignores the single family segment or lumps it together with multifamily.

“Single family rentals are very distinct from multifamily and they behave very differently,” said Khater in an interview with Real Estate Economy Watch. For example, on a per unit basis, rents for single family rentals run 1.5 to 1.6 times higher than multifamily. Unlike multifamily, millions of single family rentals are listed on MLSs by real estate brokers, many of who represent new owners in acquiring investment properties. As the for-sale inventory has trended down since 2005, the rental share rose 13.3 percent last year alone. As of the end of last year rental closings were up 11.5 percent year-over-year while prices fell 9.8 percent during the year. Demand is strong. The national average months’ supply for single family rentals was 4.5 months in December compared to 6.2 months for homes listed for sale.

Another important difference is the nature of the tenants. Single family rentals, usually stand-alone properties in ownership settings, appeal more to families. In fact, the typical SFR tenant is a family that has just left a foreclosure and can afford to pay the rent on a former foreclosure but could not make the mortgage payment on their old home, perhaps because they bought with alternative financing or purchased at the peak and could not get a modification when their home lost value. Over the past five years, foreclosures have turned more than 3 million homeowners into renters. Typical multifamily tenants, however, are younger, generally single and more mobile, and have never owned a home.

Khater found a strong relationship between distress sales markets and single family rentals. Census data shows a correlation between single family rentals and the hardest hit areas of the so-called “sand states”-Arizona, California, Florida and Nevada.

Investors buying REOs and short sales in foreclosure markets convert them to rental units and homeowners in the same locale who have lost their homes to foreclosure rent homes that until recently were owned by other families who suffered the same ill fortune.

For more information, visit www.realestateeconomywatch.com

Five strange signs the economy is improving [infographic]

five-strange-signs

(via) click image for larger view

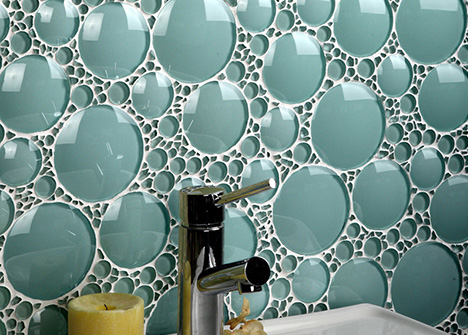
Elegant Chaos: Bathroom Backsplashes of Bubbled Glass

Take a look at some creative uses for glass in bathrooms.

Bathrooms are messy – there is just no getting around it, so why not embrace it with a splash of color and hint of natural chaos?

Evit is an Italian home materials group with a lot of conventional offerings but a few offbeat ones as well, like these colorfully animated glass surfaces that bubble up before your eyes.

Other non-conventional backdrops for your bathroom sink include smooth and textured metal tiles that reflect light but not images around the room.

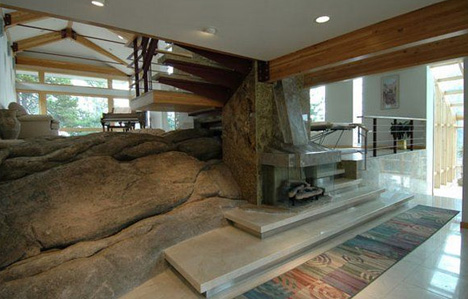
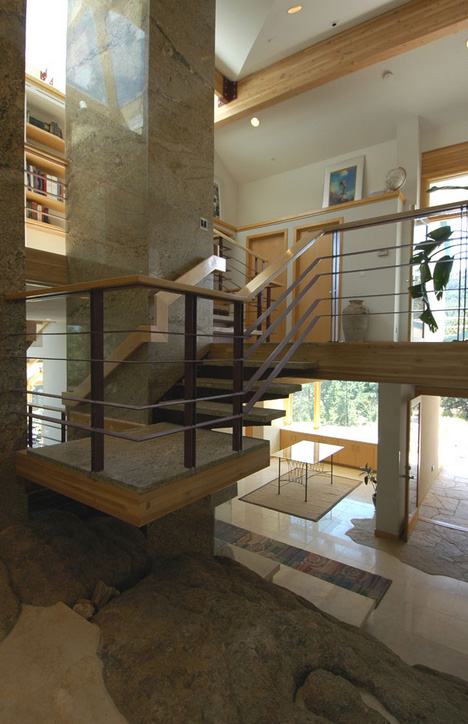
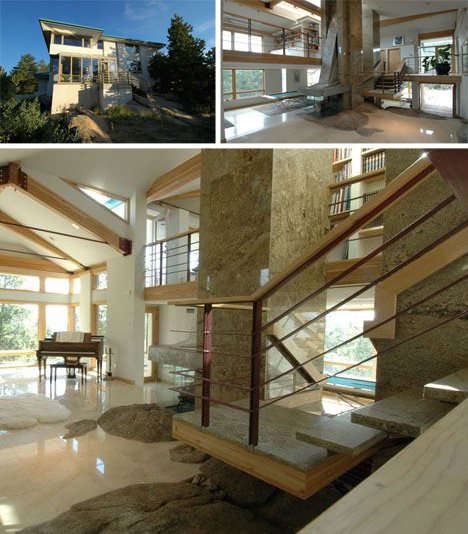
Granite Intrusion: Hilltop Home Rests on Rocky Outcrop

As wind and water weather the surface of a site, rocky outcrops are often left behind, pushing upward to form rigid peaks. Instead of blasting away this natural feature, one home embraces the existing stone in stunning ways.

Designed by Gibson Architects at an altitude of 8500 feet in the Rocky Mountains, this house turns difficult granite boulders into building assets, showing off this inherent geology in organic ways. Marble-clad elements like pillars and fireplaces rise up from the rugged ground, tying it vertically into the structure’s aesthetic, while horizontal white and wood elements provide contrast to these dark natural features.

From the architect: “Using what was considered by most to be an unbuildable granite outcropping, I took advantage of the variety and cascading effect of the natural granite to create a house which evolved into seven levels revolving around the main central fireplace built into the largest granite boulder …. The pathways in the house pinwheel around the central space whose vertical climax of the two chimney masses are anchored in the natural granite outcropping that rises from the entry and becomes the hearth of the main living fireplace. Every axis of the pathway connects with the next higher level path axis with stairs while at the same time opening up either into a direct connection to Nature outside or into a focal space.”

Rents On the Rise

rent rising

It may be time to pull the trigger and buy that investment property you’ve been considering. The greater Seattle area have several opportunities.